Research Poster Template: 3 Layouts and How to Fill Them
 Aiko Tanaka
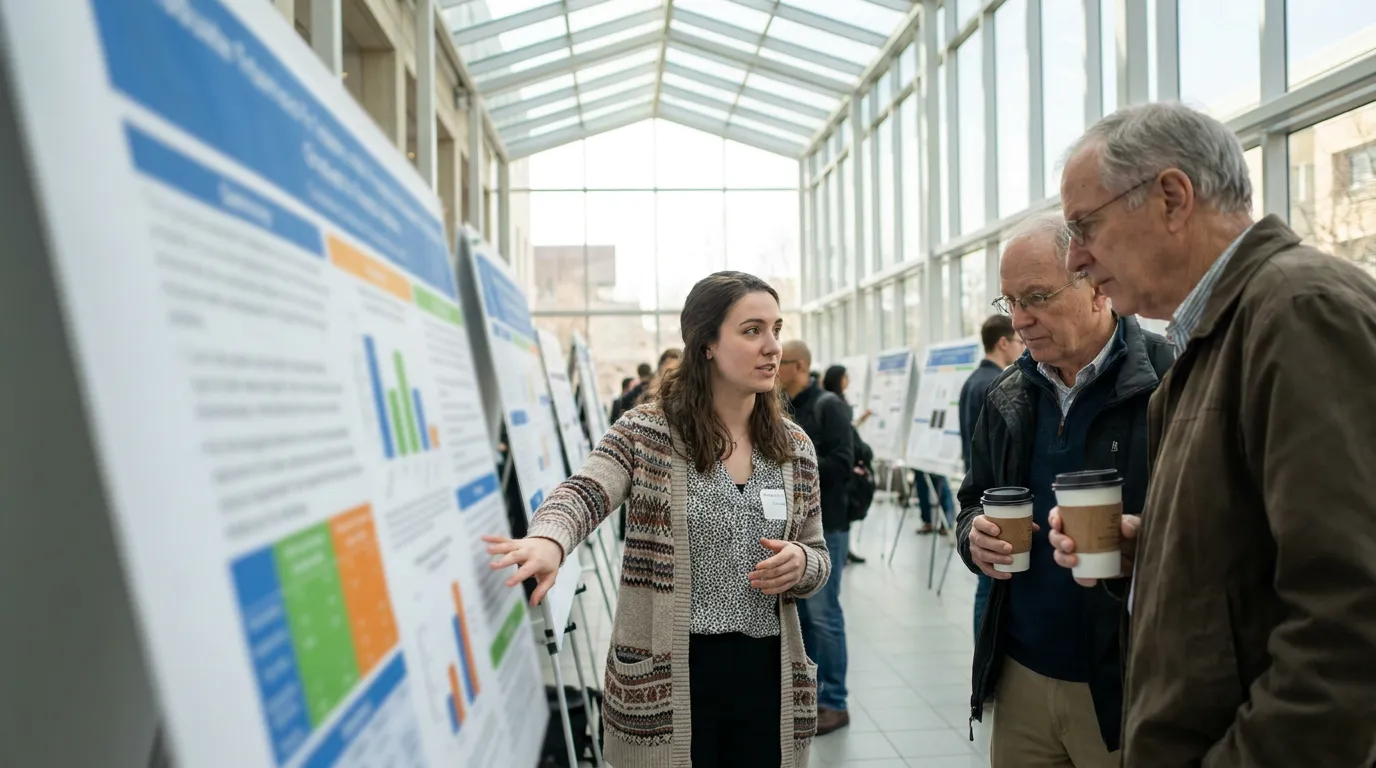
A research poster has to work in two modes at once: as a billboard that stops someone walking down a crowded aisle, and as a short paper they can read in five minutes while you stand beside it. Graduate students at a department symposium, undergraduates at a summer research showcase and clinicians at a regional conference all face the same blank 48 x 36 inch canvas. The three research poster templates below cover the sizes almost every event asks for, and each section comes with what to write, how long to make it and which chart fits.
Direct answer. A research poster template is a pre-sized layout with a title banner and labeled sections for Introduction, Methods, Results, Conclusions and References. Pick the template that matches your required size (48 x 36 in landscape, 36 x 48 in portrait or A0), keep the total near 1,000 words, give Results the largest area, and print from a full-size PDF.
Template 1: Landscape 48 x 36 Inch, Three Columns
The landscape three-column layout is the default scientific poster template at North American conferences. The University of Florida's undergraduate research presentation templates are built at 48 x 36 inches, and most PowerPoint poster templates start from the same size.

How the grid works:
- Title banner (top 15%). Title, authors, affiliations, and institution or lab logos at both ends.
- Left column. Introduction, a boxed research question, Methods as a three-step diagram, and a study-area map or photo.
- Center column (widest). A one-sentence key finding in a tinted box, then the two most important figures.
- Right column. Conclusions as three bullets, next steps, references, acknowledgments and a QR code.
The center column is roughly 1.5 times wider than the side columns, which pulls the eye to the results first. Visitors read columns top to bottom, then left to right, so a viewer who only has 30 seconds still lands on the finding.
Template 2: Portrait 36 x 48 Inch, Two Columns With a Results Band
Portrait boards are common at medical, education and psychology meetings, and at school research days where posters hang on easels. Two columns fit a 36-inch width comfortably; three columns at that width force narrow text blocks and small charts.

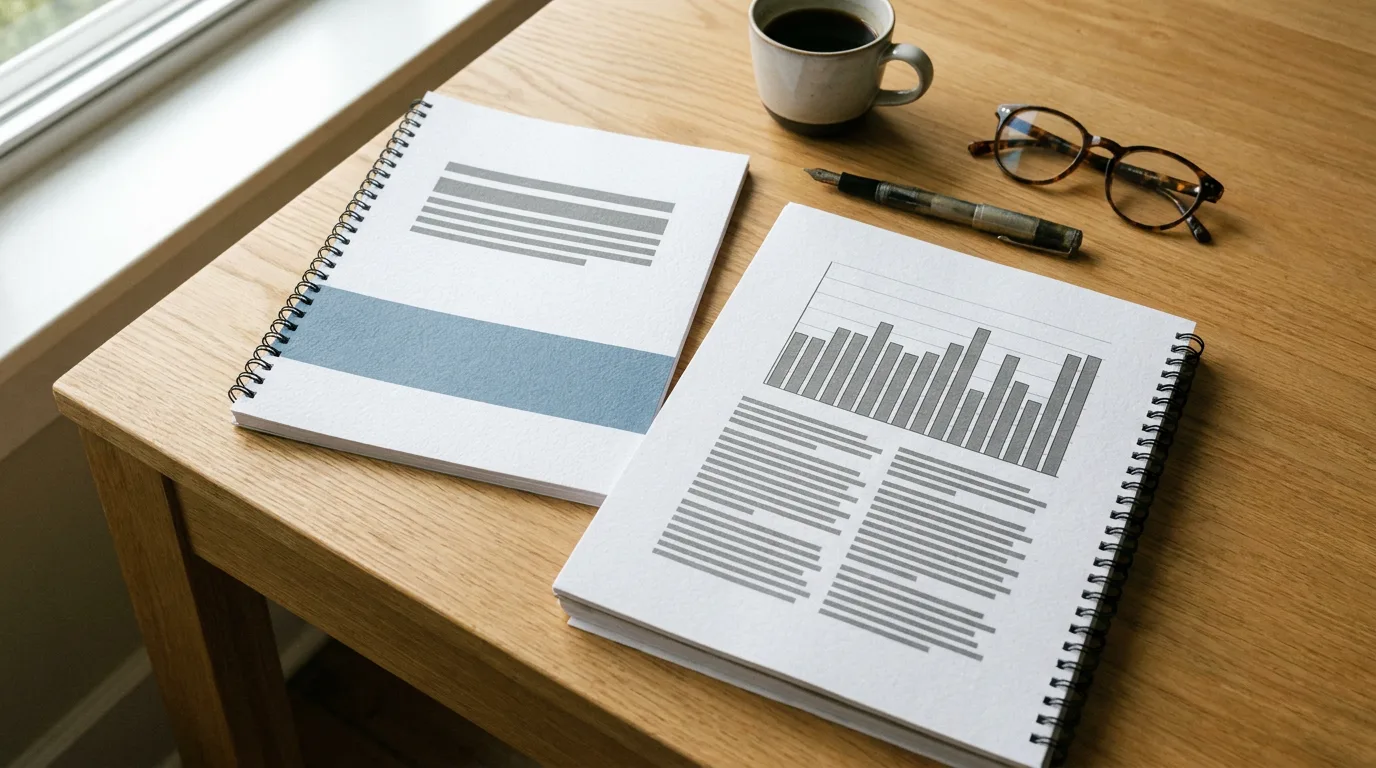
The structure in the left half of the image above:
- Title banner with one logo and a two-line title.
- Background and Methods side by side, with a Hypothesis box and a sample-size callout ("n = 120 students").
- A full-width Results band holding two charts next to each other, the widest element on the poster.
- Conclusions and Limitations side by side.
- A footer strip with references and a QR code.
The full-width results band solves the main portrait problem: charts squeezed into an 18-inch column become hard to read from 6 feet away.
Template 3: A0 Portrait, Takeaway First
A0 (841 x 1189 mm, about 33.1 x 46.8 inches) is the standard at many European and Asian conferences. The template on the right of the image above borrows the "billboard" approach popularized by Mike Morrison's #betterposter design: the main finding, written as a plain-language sentence in very large type, fills the top third. Supporting figures, Methods and a "Why it matters" block sit below, and a tinted "details for close readers" panel at the bottom holds references and the QR code.
This layout trades some detail for traffic. People stop because they can understand the result from across the aisle, then step closer for the methods. It works especially well for a single, clear finding; studies with several equal results usually read better in Template 1.
For the exact pixel dimensions of each size at 300 DPI, the research poster size page lists them, and the standard poster sizes guide compares A0 with US sizes.
What to Write in Each Section
Every template above uses the same sections. The word counts come from Colin Purrington's poster design guide, which suggests about 200 words each for Introduction, Methods, Results and Conclusions, about 40 for Acknowledgments, and 1,000 words or fewer in total, so a visitor can read the whole poster in five to ten minutes.
| Section | Target length | What goes in it |
|---|---|---|
| Title | 1–2 lines | The finding or the question, in plain words |
| Introduction | ~200 words | Why the problem matters, what is known, the gap, your research question |
| Methods | ~200 words | Design, sample, key measures; a diagram beats a paragraph |
| Results | ~200 words + legends | Three to five figures, each with a one-line takeaway caption |
| Conclusions | 3–4 bullets | What the result means, limits, next step |
| References | 3–6 entries | Small type, short citation style |
| Acknowledgments | ~40 words | Advisors, collaborators, funding sources and grant numbers |
Two writing habits make the biggest difference. First, write the title as the result ("Street Trees Keep Riverton Blocks Cooler in July") instead of the topic ("An Analysis of Urban Canopy and Surface Temperature"). Second, give every figure a caption that states what it shows, so the poster still makes sense to someone who reads only the captions.
Charts and Figures That Read From 6 Feet
Purrington's guide also recommends that details on graphs and photographs be comfortable to view from 6 feet away. That single rule decides most chart choices on a scientific poster:
- Bar chart for comparing groups or conditions. Sort bars by value and label them directly.
- Line chart for change over time or dose-response. Use two or three lines at most, in clearly different colors.
- Scatter plot for relationships, with the fitted line and the r or R² value printed on the chart.
- Map or photo for field sites, specimens or equipment; one large image beats four thumbnails.
- Flow diagram for methods, with three to five boxes.
Remove gridlines, legends that could be direct labels, and 3D effects. Use one accent color for the result you want people to notice and grey for everything else. When the numbers are ready but the chart is not, the AI chart generator turns a pasted table into an editable bar, line or pie chart you can restyle to match the poster.
How to Make a Research Poster, Step by Step
- Check the rules. Note the board size, orientation, and any required logo or disclaimer.
- Write the finding in one sentence. This becomes the title, the key-finding box or the A0 billboard band.
- Choose the template that matches the size: Template 1 for 48 x 36 landscape, Template 2 for 36 x 48 portrait, Template 3 for A0 or a single headline result.
- Draft text in a document first, then trim each section to its target length.
- Build figures at final size. A chart exported small and stretched to fill a 20-inch column prints blurry.
- Set type for distance. A common rule of thumb is a title of 72 pt or more, section headers around 36–44 pt, and body text of at least 24 pt.
- Print a letter-size proof, read it at arm's length, and cut anything that's hard to read.
- Export a print PDF at full size and send it to the print shop or campus print center a few days early.
Playyy's AI poster generator builds research posters at the 36 x 48 preset or any custom size from a description of the study. Choose Editable design, and the title, every section and each figure land on the canvas as separate layers you can rewrite, resize or swap. An existing poster in PowerPoint or PDF can be imported as editable content and redesigned in place, and the finished file exports as a print PDF with crop marks and bleed, or as a PNG for a virtual poster session.
Science Fair Poster Ideas for Students
School science fairs use a different canvas: a tri-fold display board, typically 36 x 48 inches when unfolded. The same principles carry over, arranged across three panels:
- Center panel: project title and the question, in the largest type, plus the hypothesis and a key photo.
- Left panel: background research, materials and procedure, with numbered steps.
- Right panel: data table, one or two charts, results and conclusion.
Science fair poster ideas that help a board stand out: a large photo of the experiment in progress, a "What we expected vs. what happened" box, a real sample or prototype on the table in front of the board, and a one-line answer to "Why does this matter?" at the bottom of the right panel. Students who want more layout inspiration can browse these research and event poster ideas.
Pick the Template, Then Cut the Words
The best research poster template is the one that matches the board you've been assigned: 48 x 36 landscape with three columns, 36 x 48 portrait with a full-width results band, or A0 with the finding as a billboard. Keep the total near 1,000 words, give Results the most space, make every chart readable from 6 feet, and proof a small print before the real one. To skip the blank canvas, describe your study to the AI poster generator and edit the generated layout section by section.

Aiko Tanaka
I work with boutique brands, cafes, creators and small businesses on visual systems, layout discipline, typography and moodboards. My focus is on fast concept exploration that still has a strong design point of view.
Frequently asked questions
A research poster runs top to bottom and left to right: a title banner with authors, affiliations and logos, then Introduction, Methods, Results and Conclusions in two to four columns, with References, Acknowledgments and a QR code in a small block at the bottom. Results get the most space because figures carry the argument.